SeaLevelMap
2025-11-07
Tags: maps, data-visualization, webgl, open-data
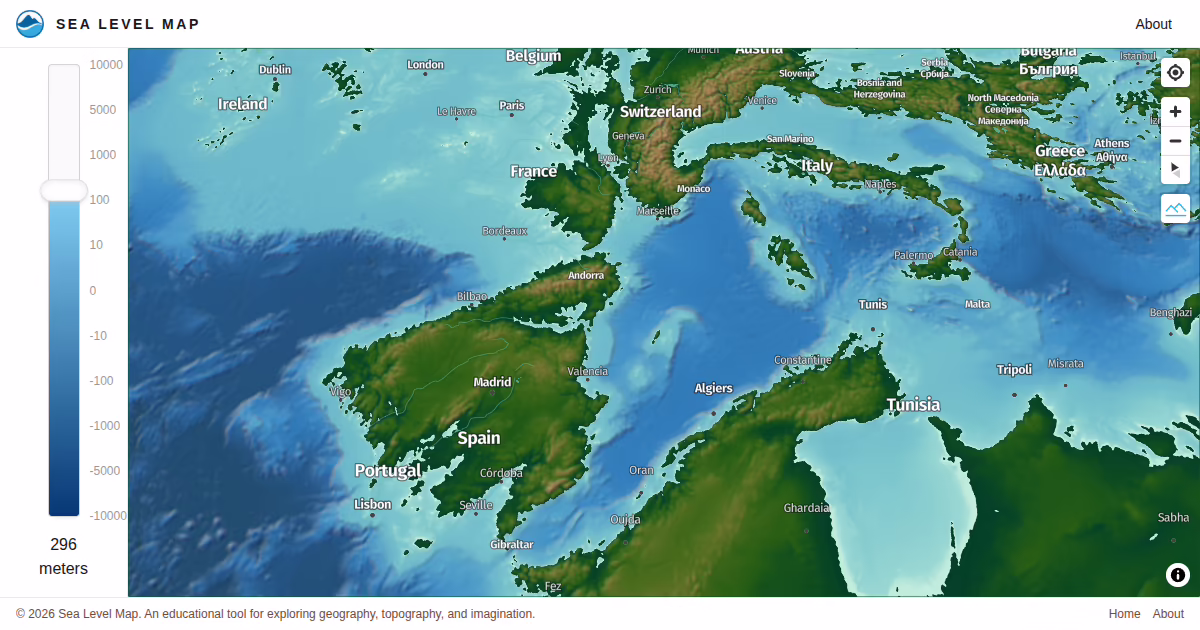
Interactive map with hillshading and bathymetry — drag the sea level slider and watch coastlines shift in real time.
Project link: sea-level-map.vercel.app
SeaLevelMap is an interactive map that lets you raise or lower sea level and see the result on terrain and ocean floor in real time.
Drag the slider up and mountains emerge from the sea. Drag it down and coastal plains disappear. The hillshading — including underwater bathymetry — updates continuously as you move it.
Built for curiosity and casual exploration: what does Italy look like at −100 m? What was the Adriatic during the last ice age? What happens to the Po Valley if sea level rises 10 m?
- Year: 2025
- Status: public preview